Research
Disaster Copilot: Agentic AI for Collective Human–Machine Intelligence in Disaster Management |
|
|
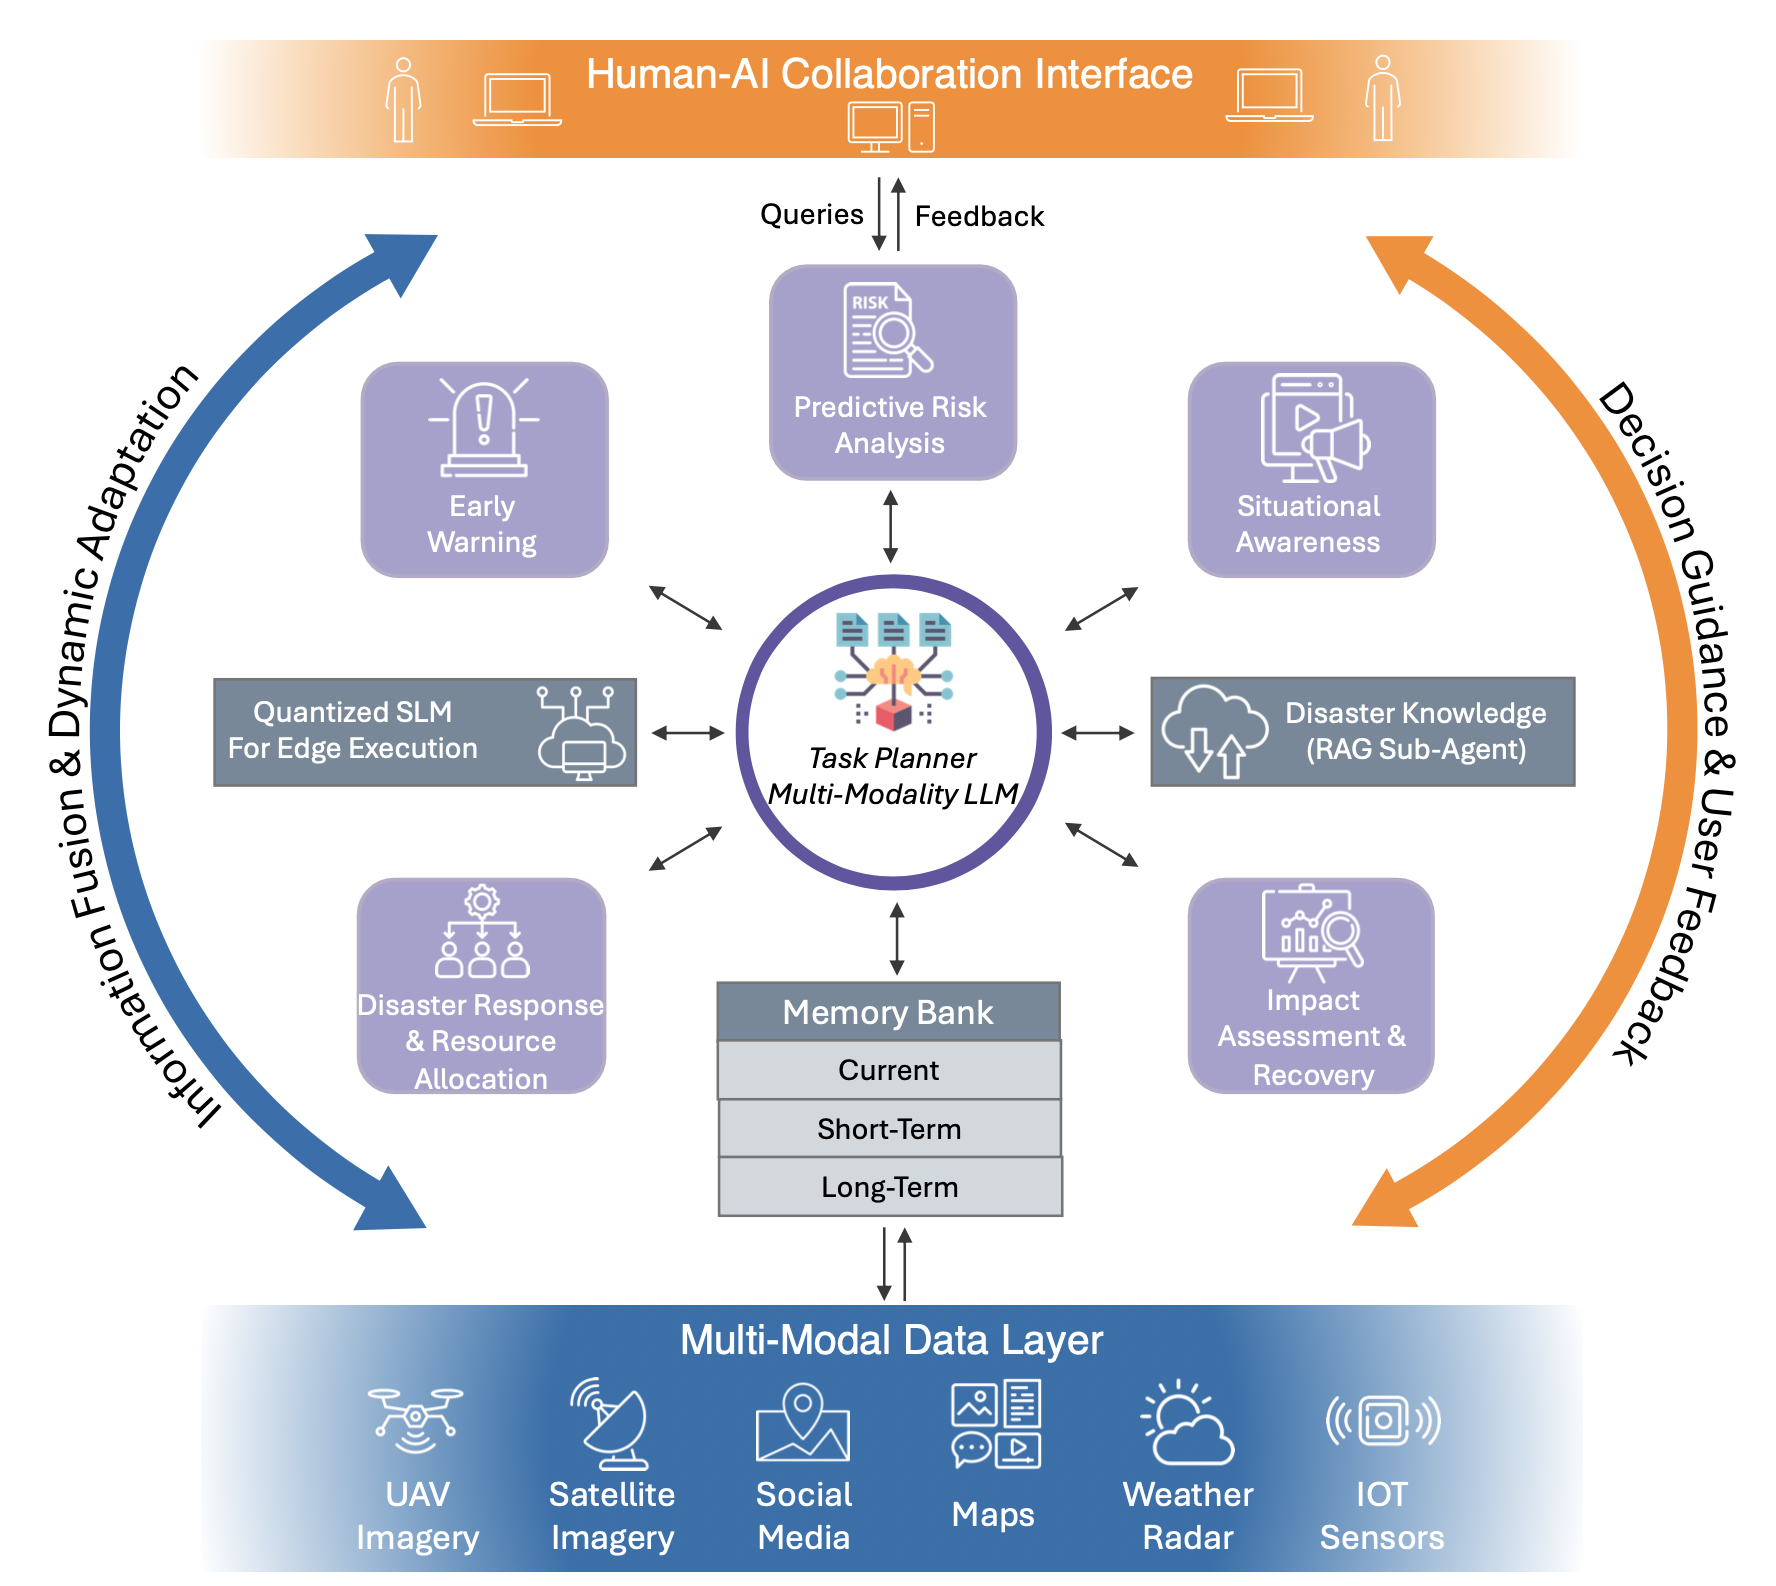
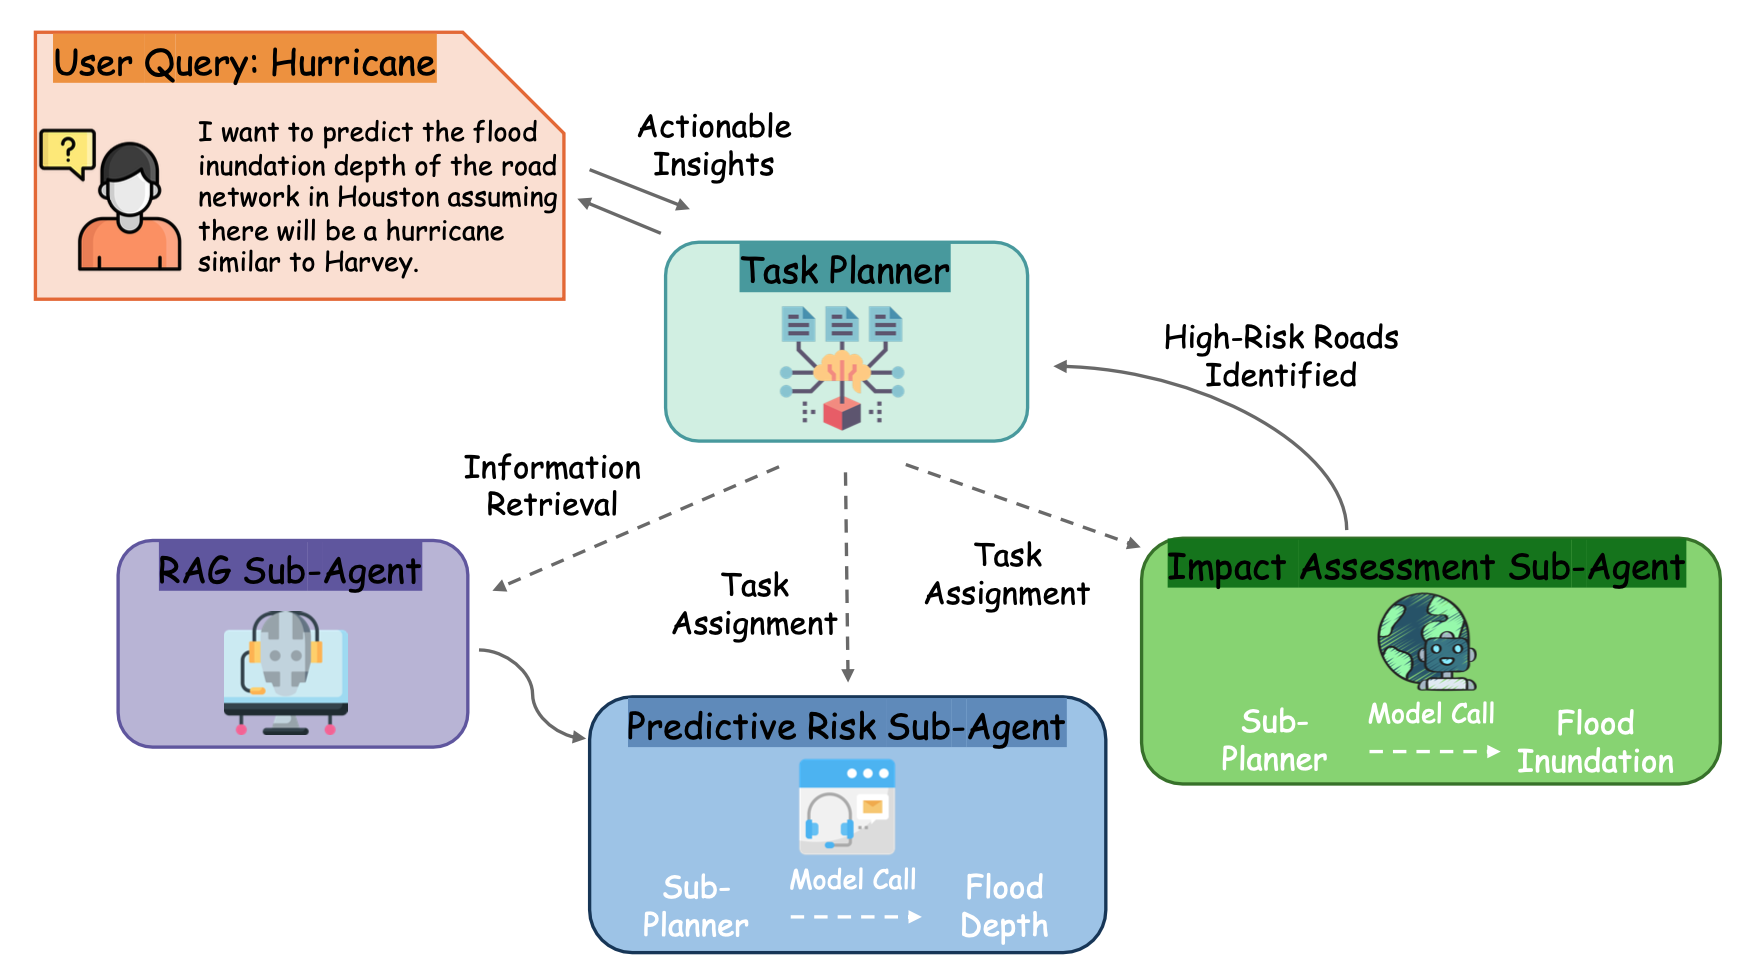
Escalating disaster risks increasingly overwhelm traditional response systems due to fragmented data, siloed AI tools, and the loss of institutional knowledge. This study introduces Disaster Copilot, a multi-agent AI framework that orchestrates specialized disaster analytics into a unified, human-centered decision-support system, enabling adaptive, real-time disaster management across all phases of response and recovery. Project Highlights:
|
|
Check out the paper here! |
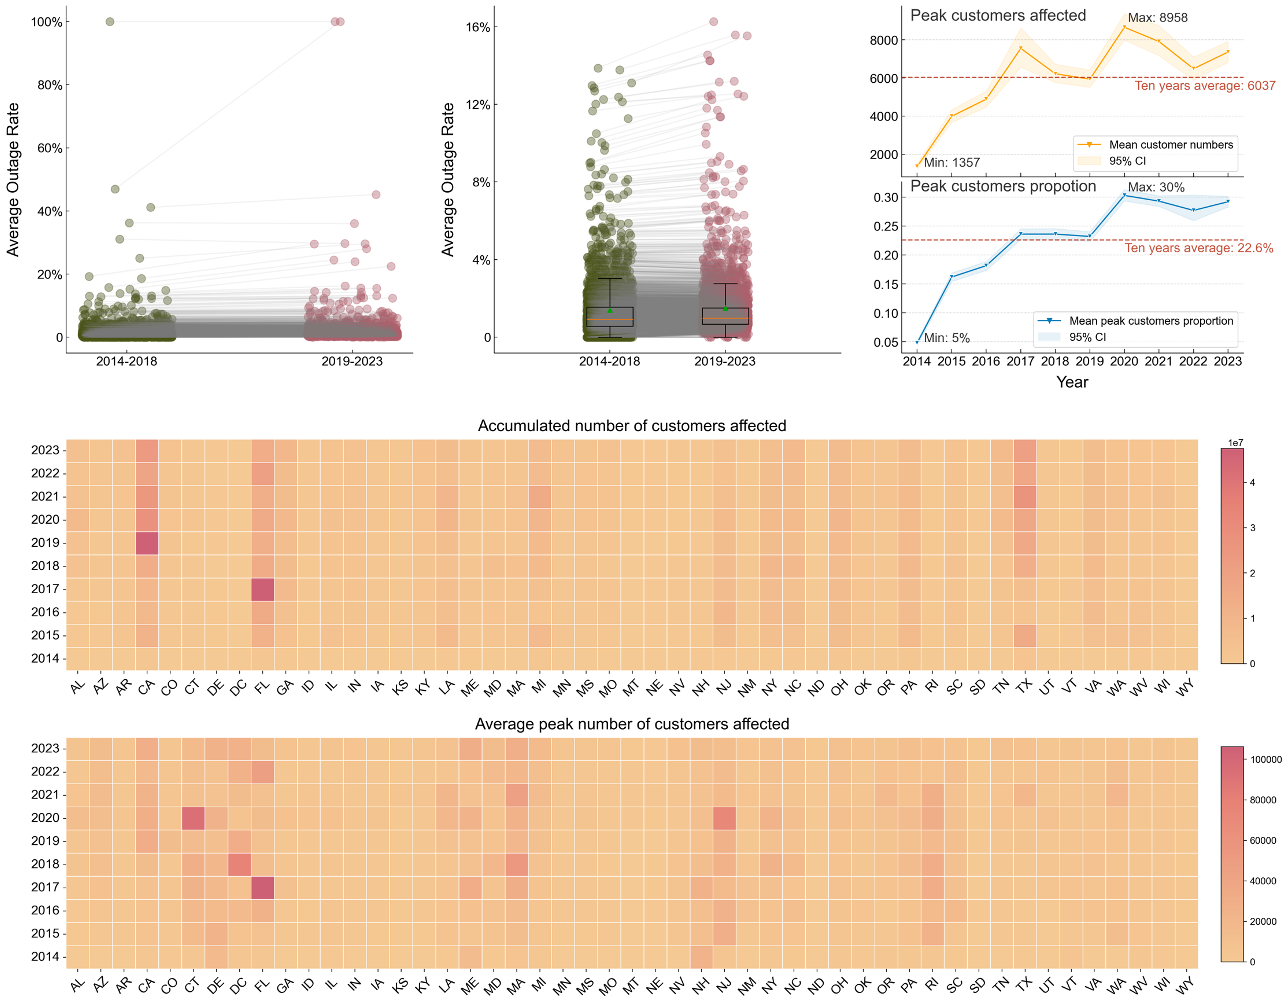
Characterize Decadal Spatiotemporal Trend of Power Outages |
|
|
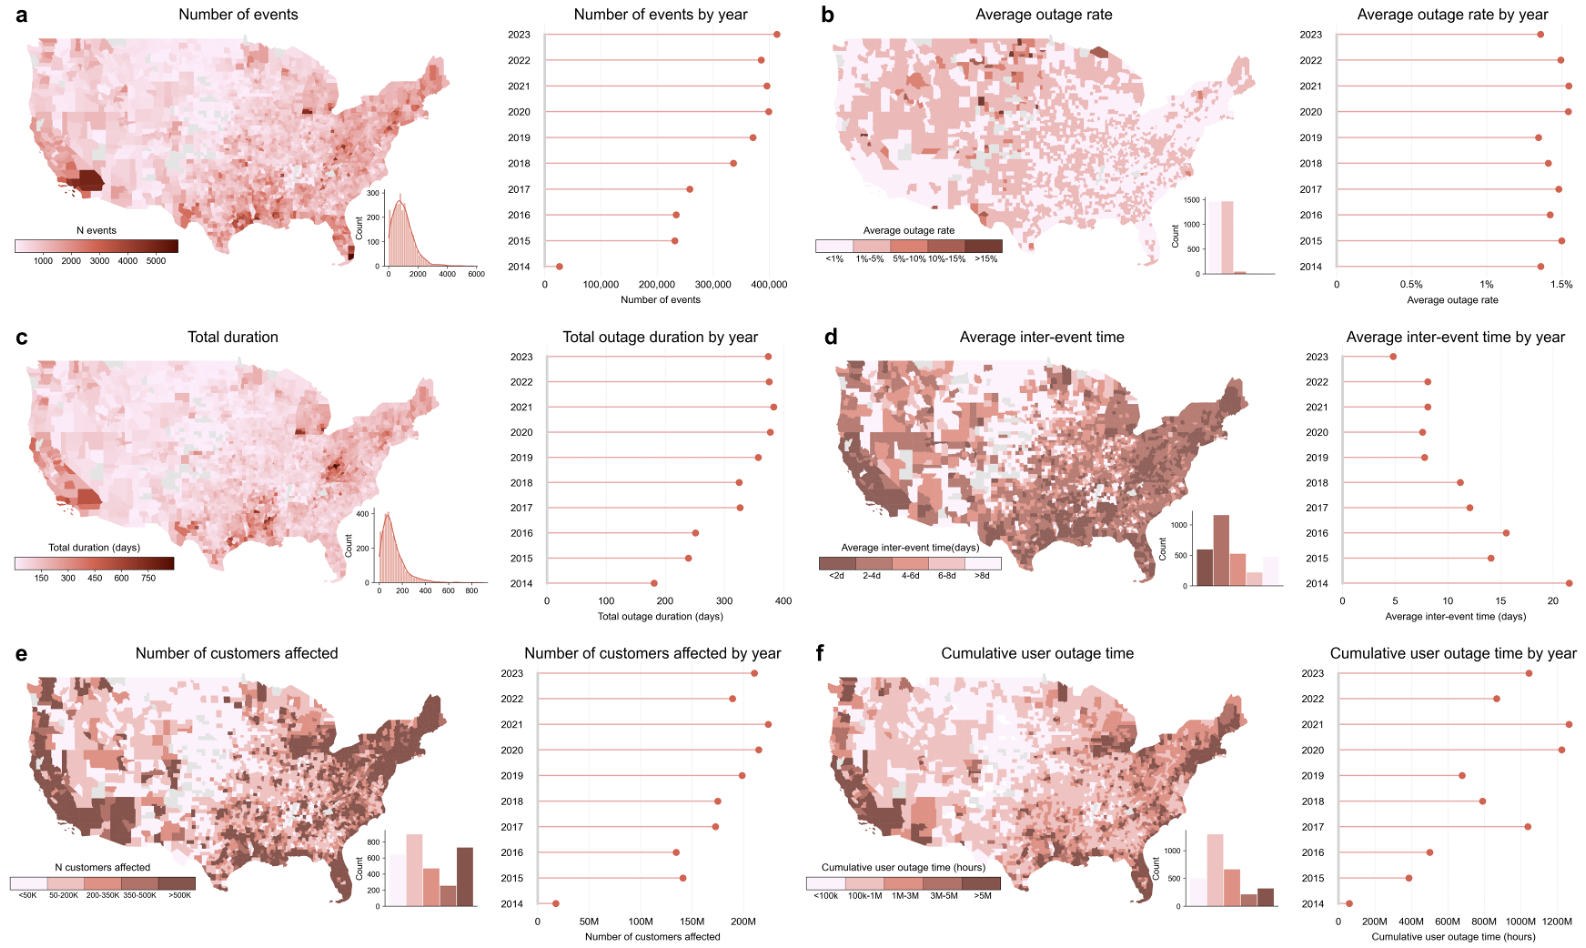
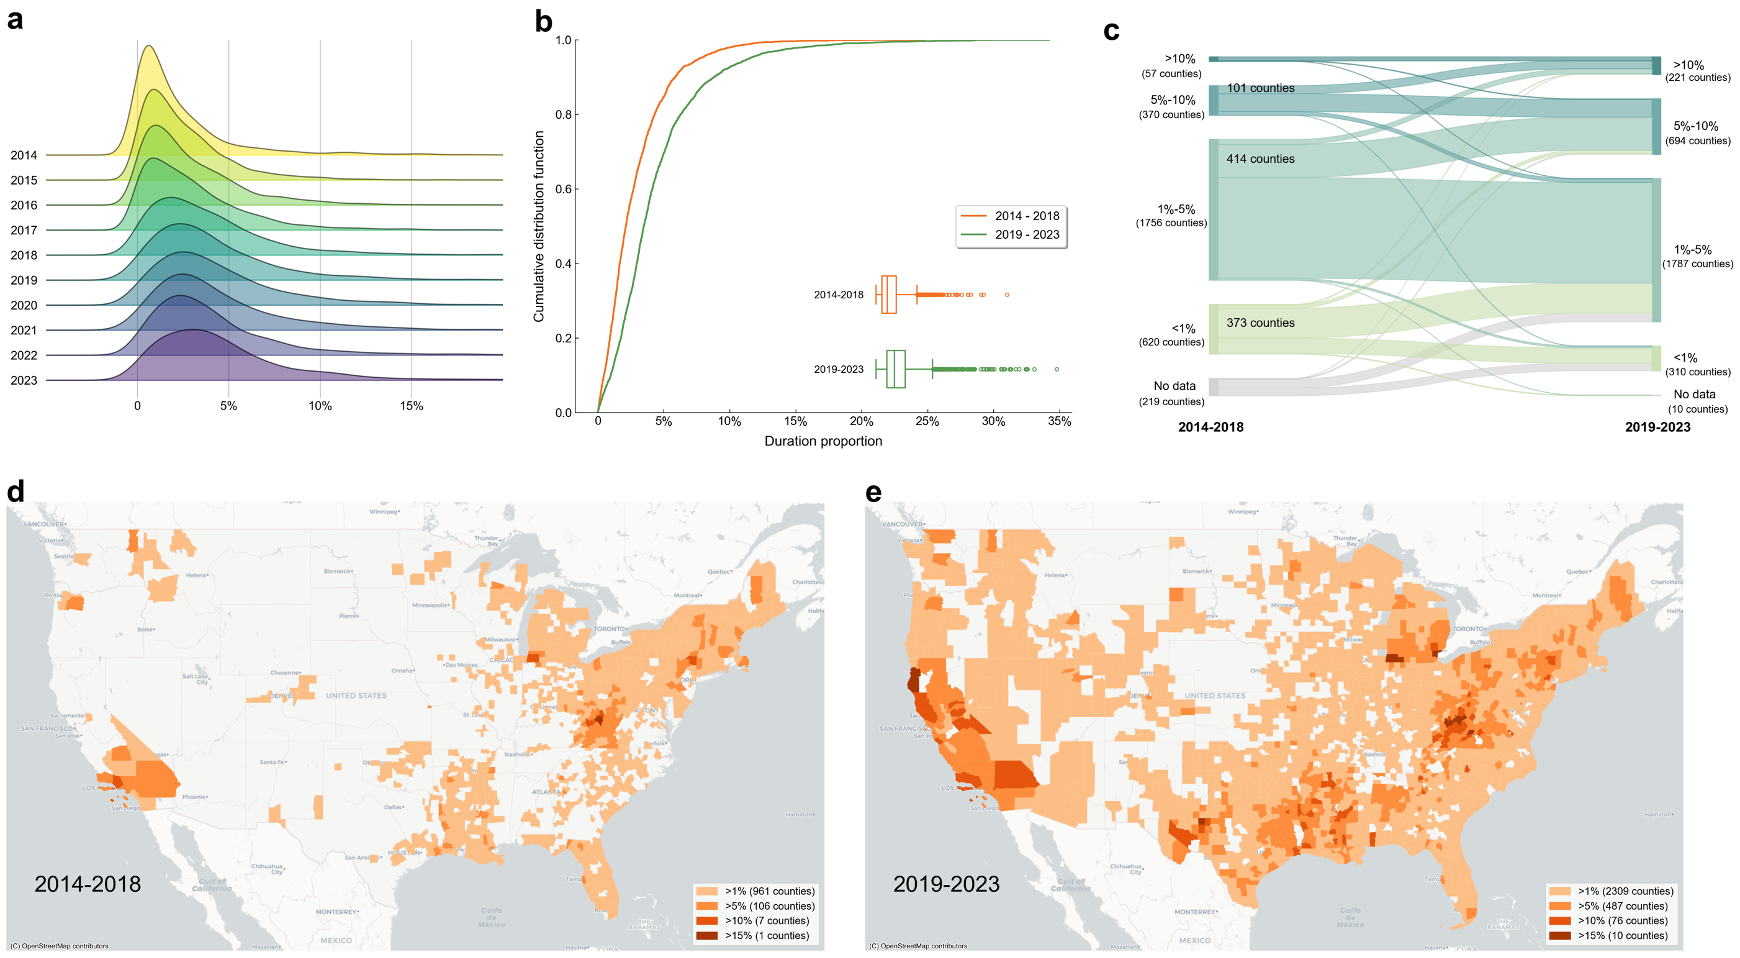
This study provides a nationwide, longitudinal assessment on U.S. power system vulnerability. Project Highlights:
|
|
Check out the paper here! |
|
Relevant info:
|
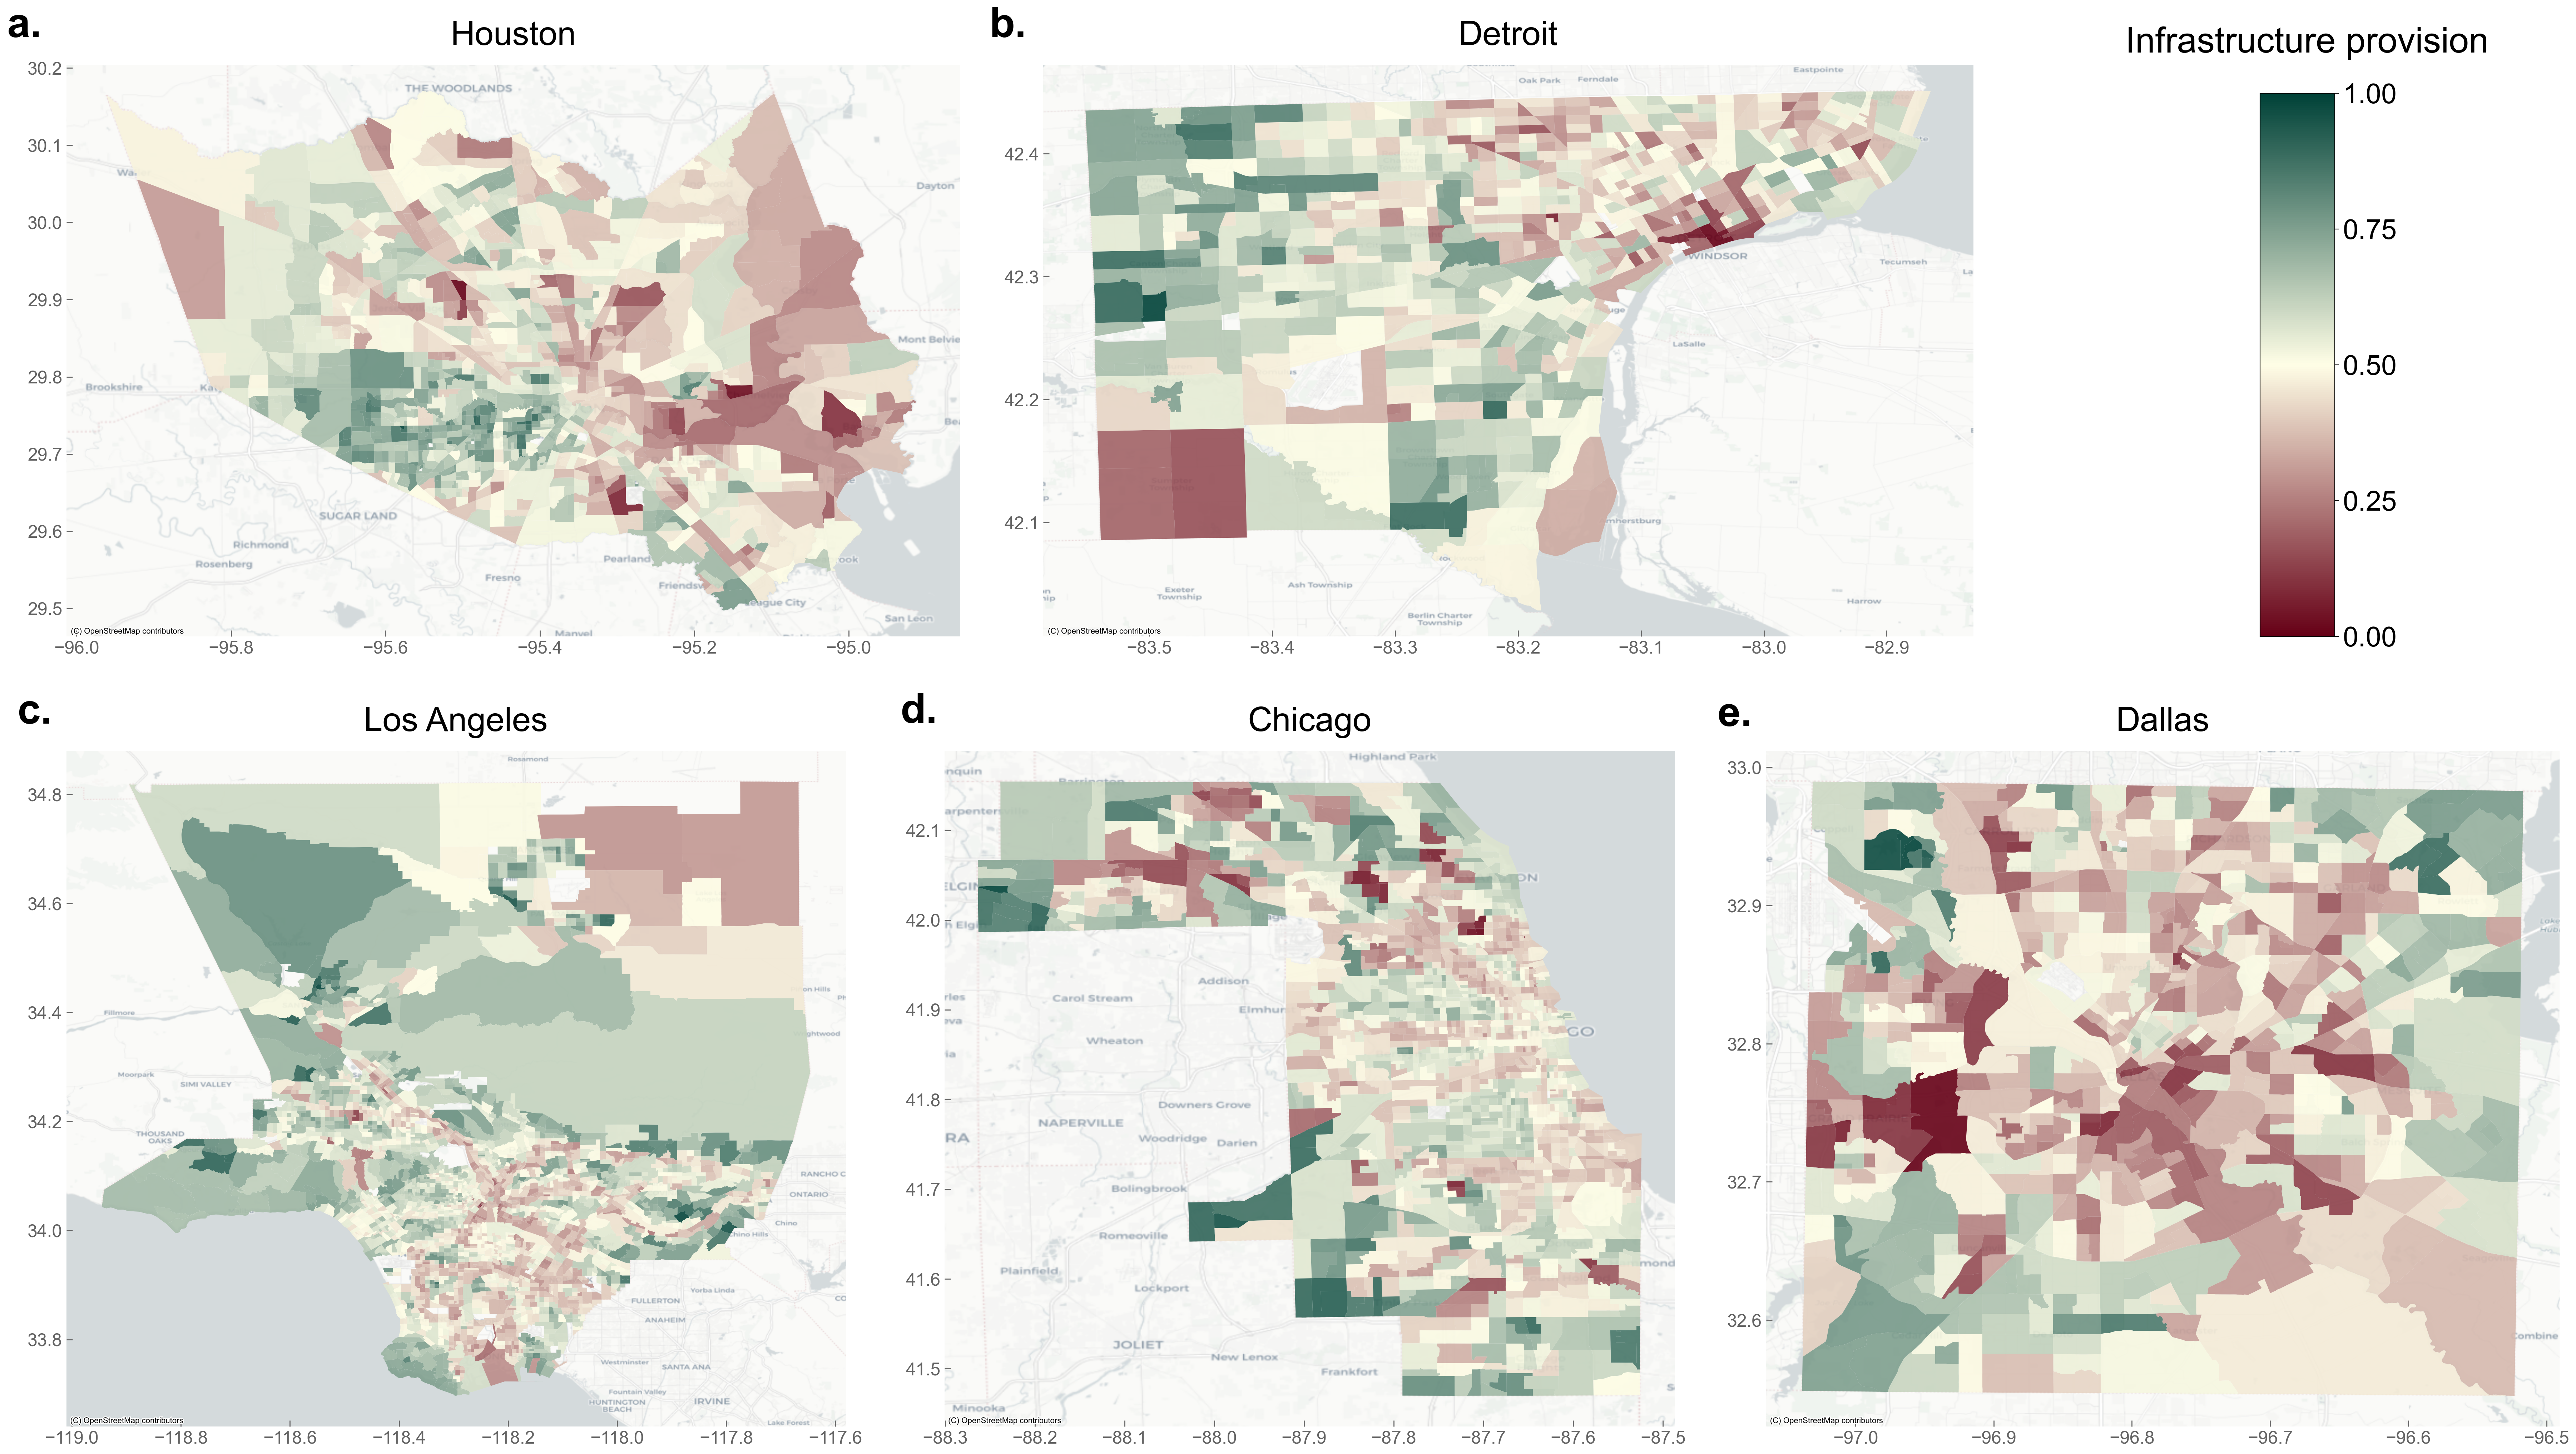
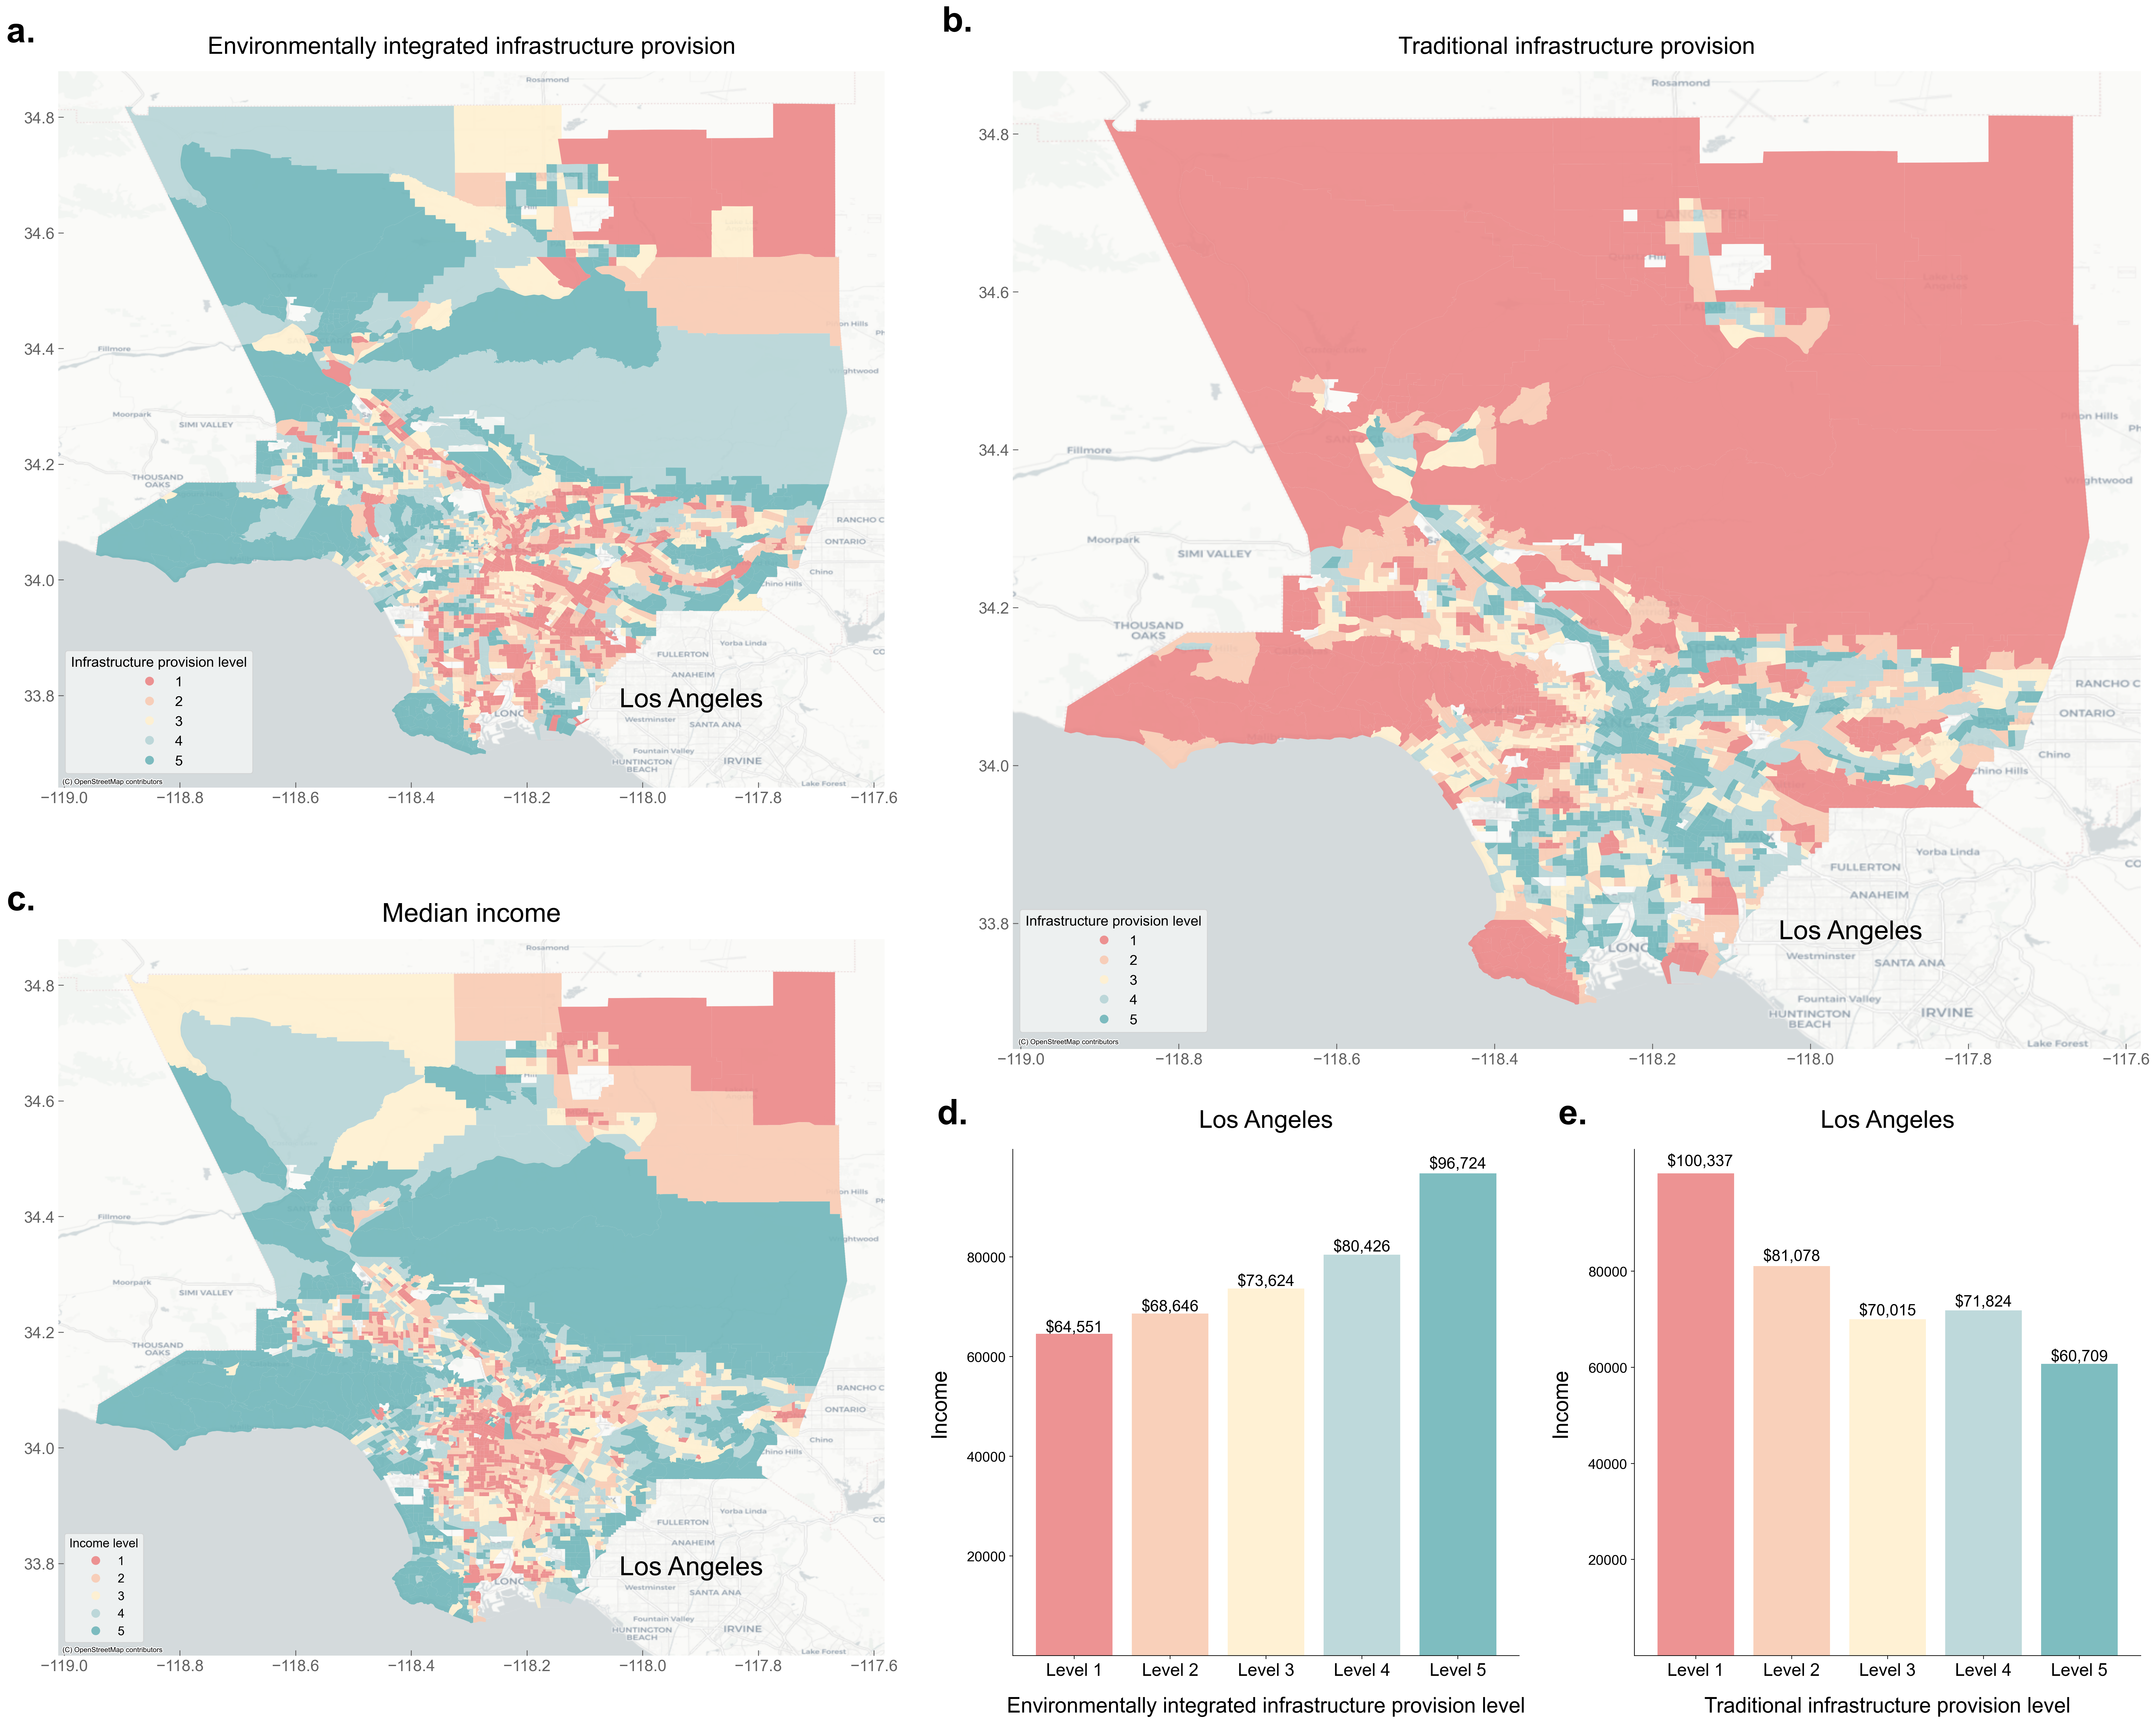
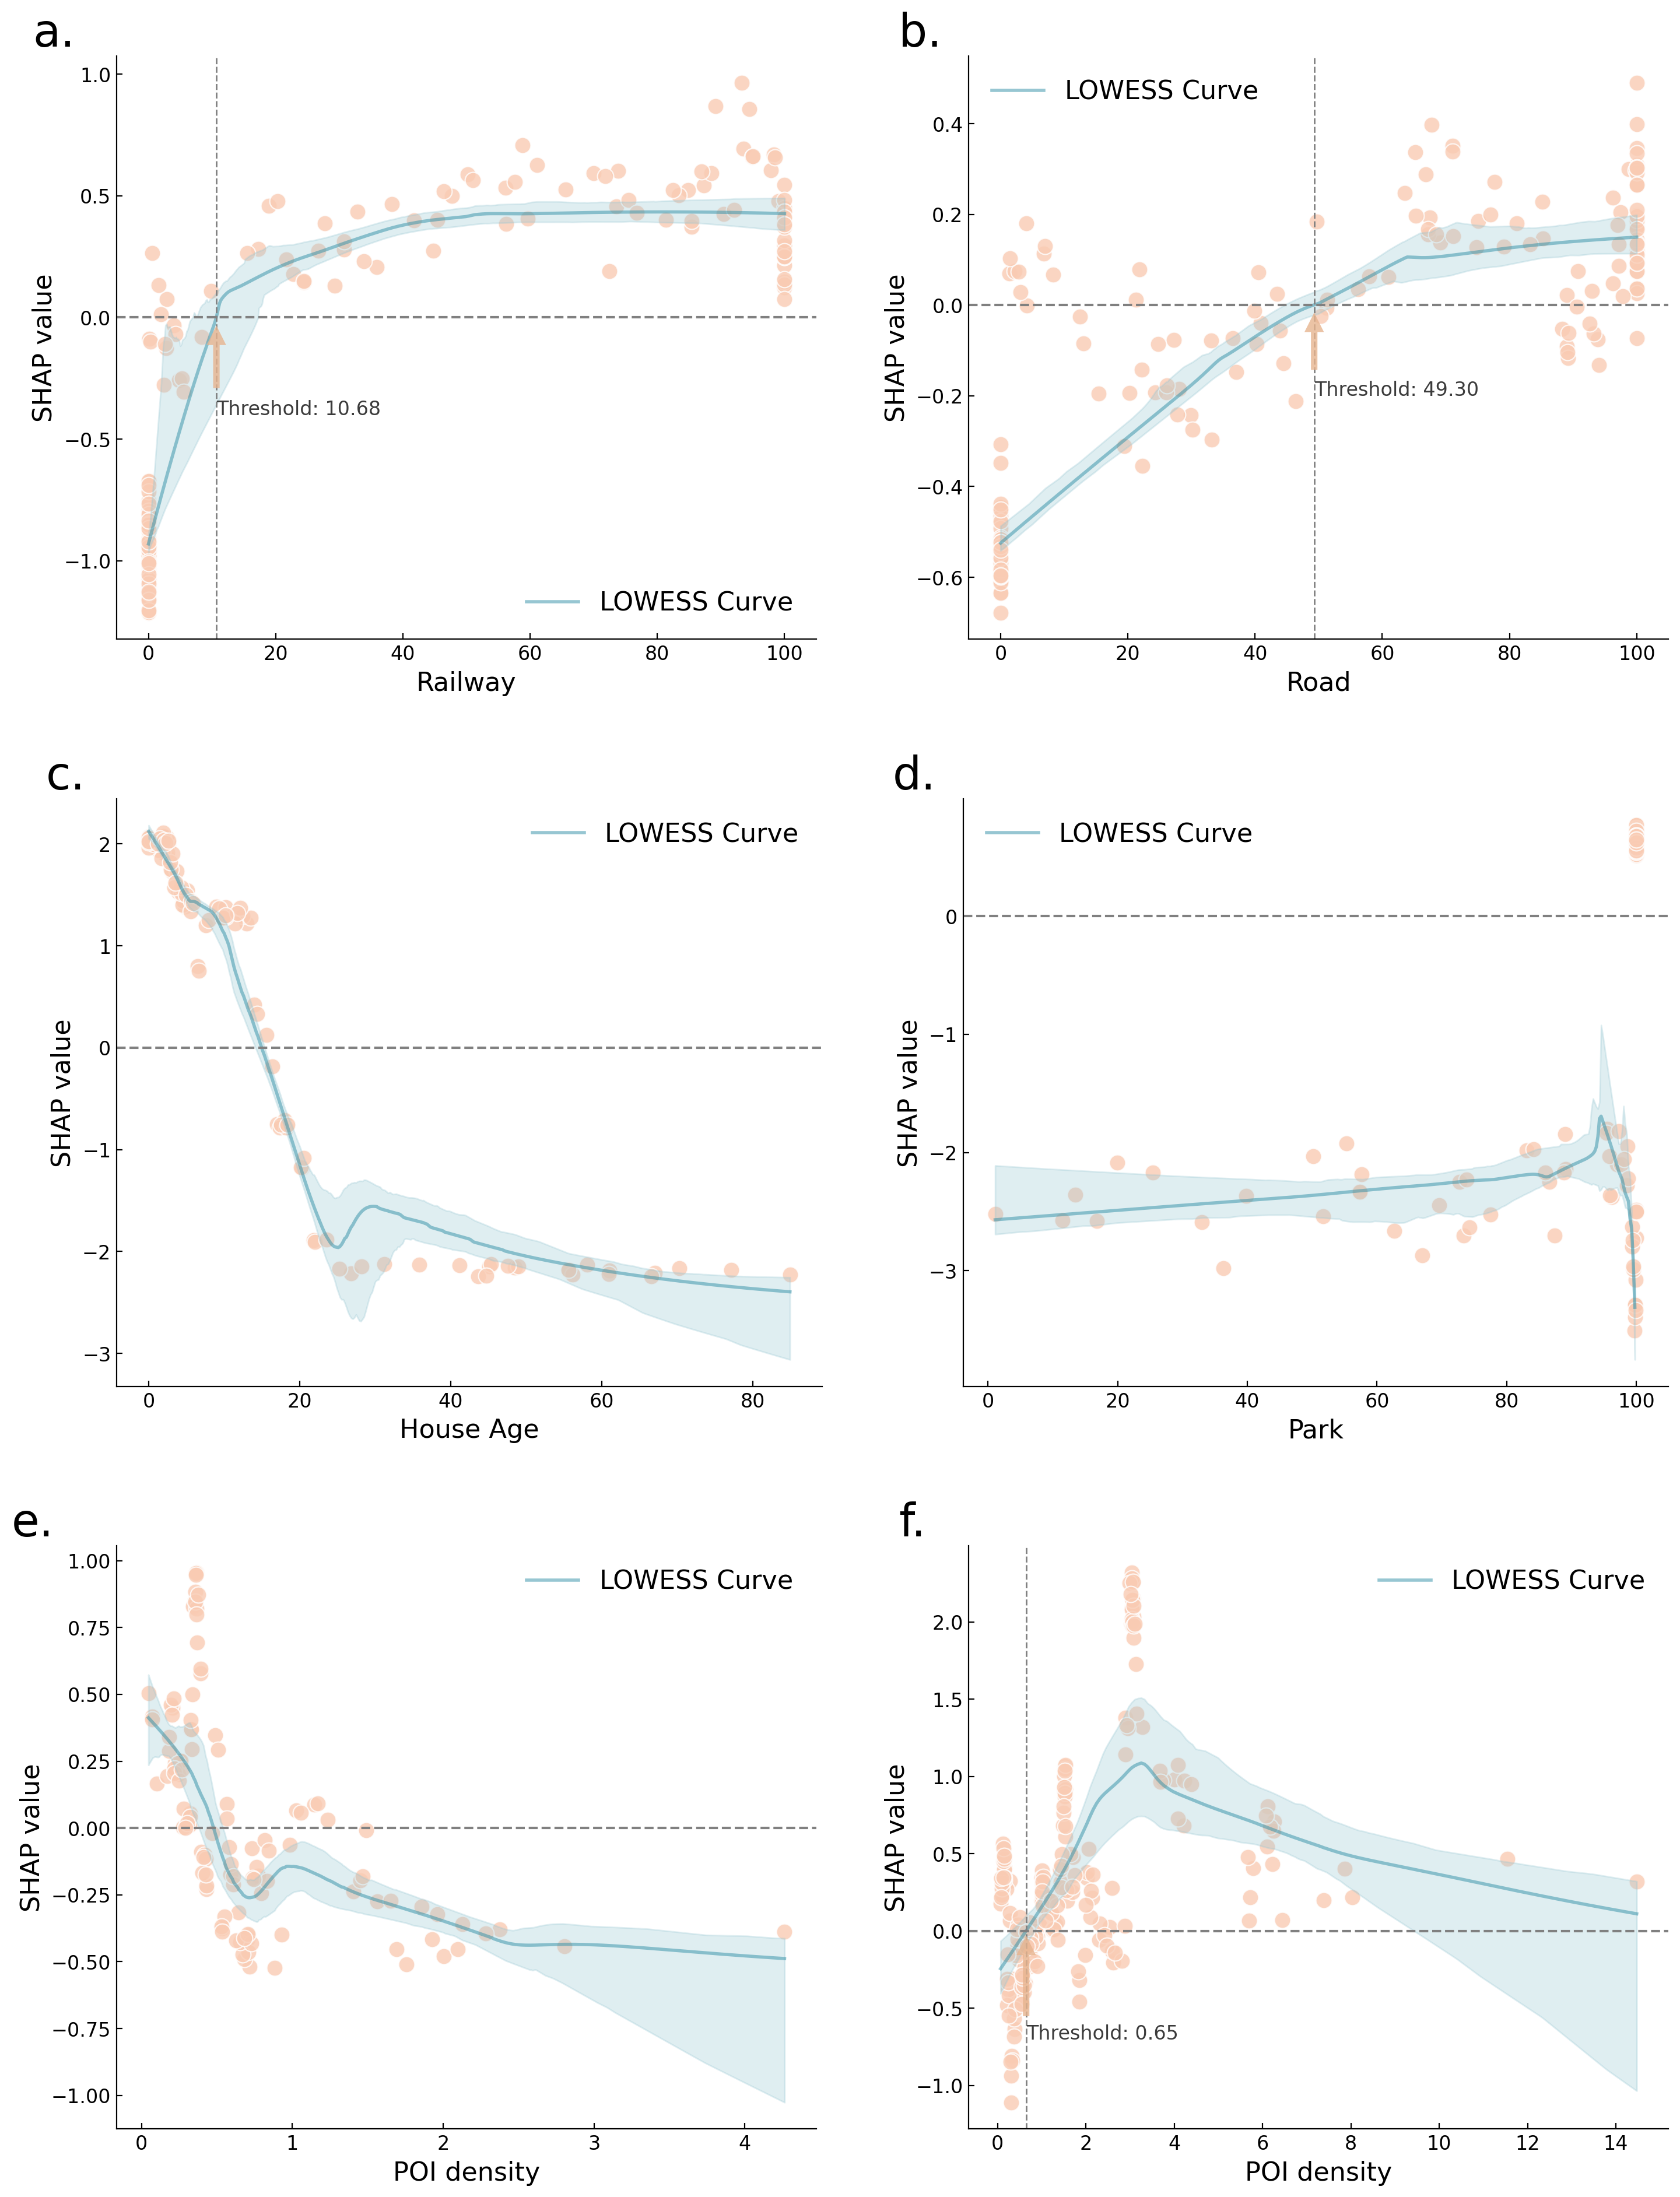
Incorporate Environmental Considerations into Infrastructure Inequality Evaluation |
|
|
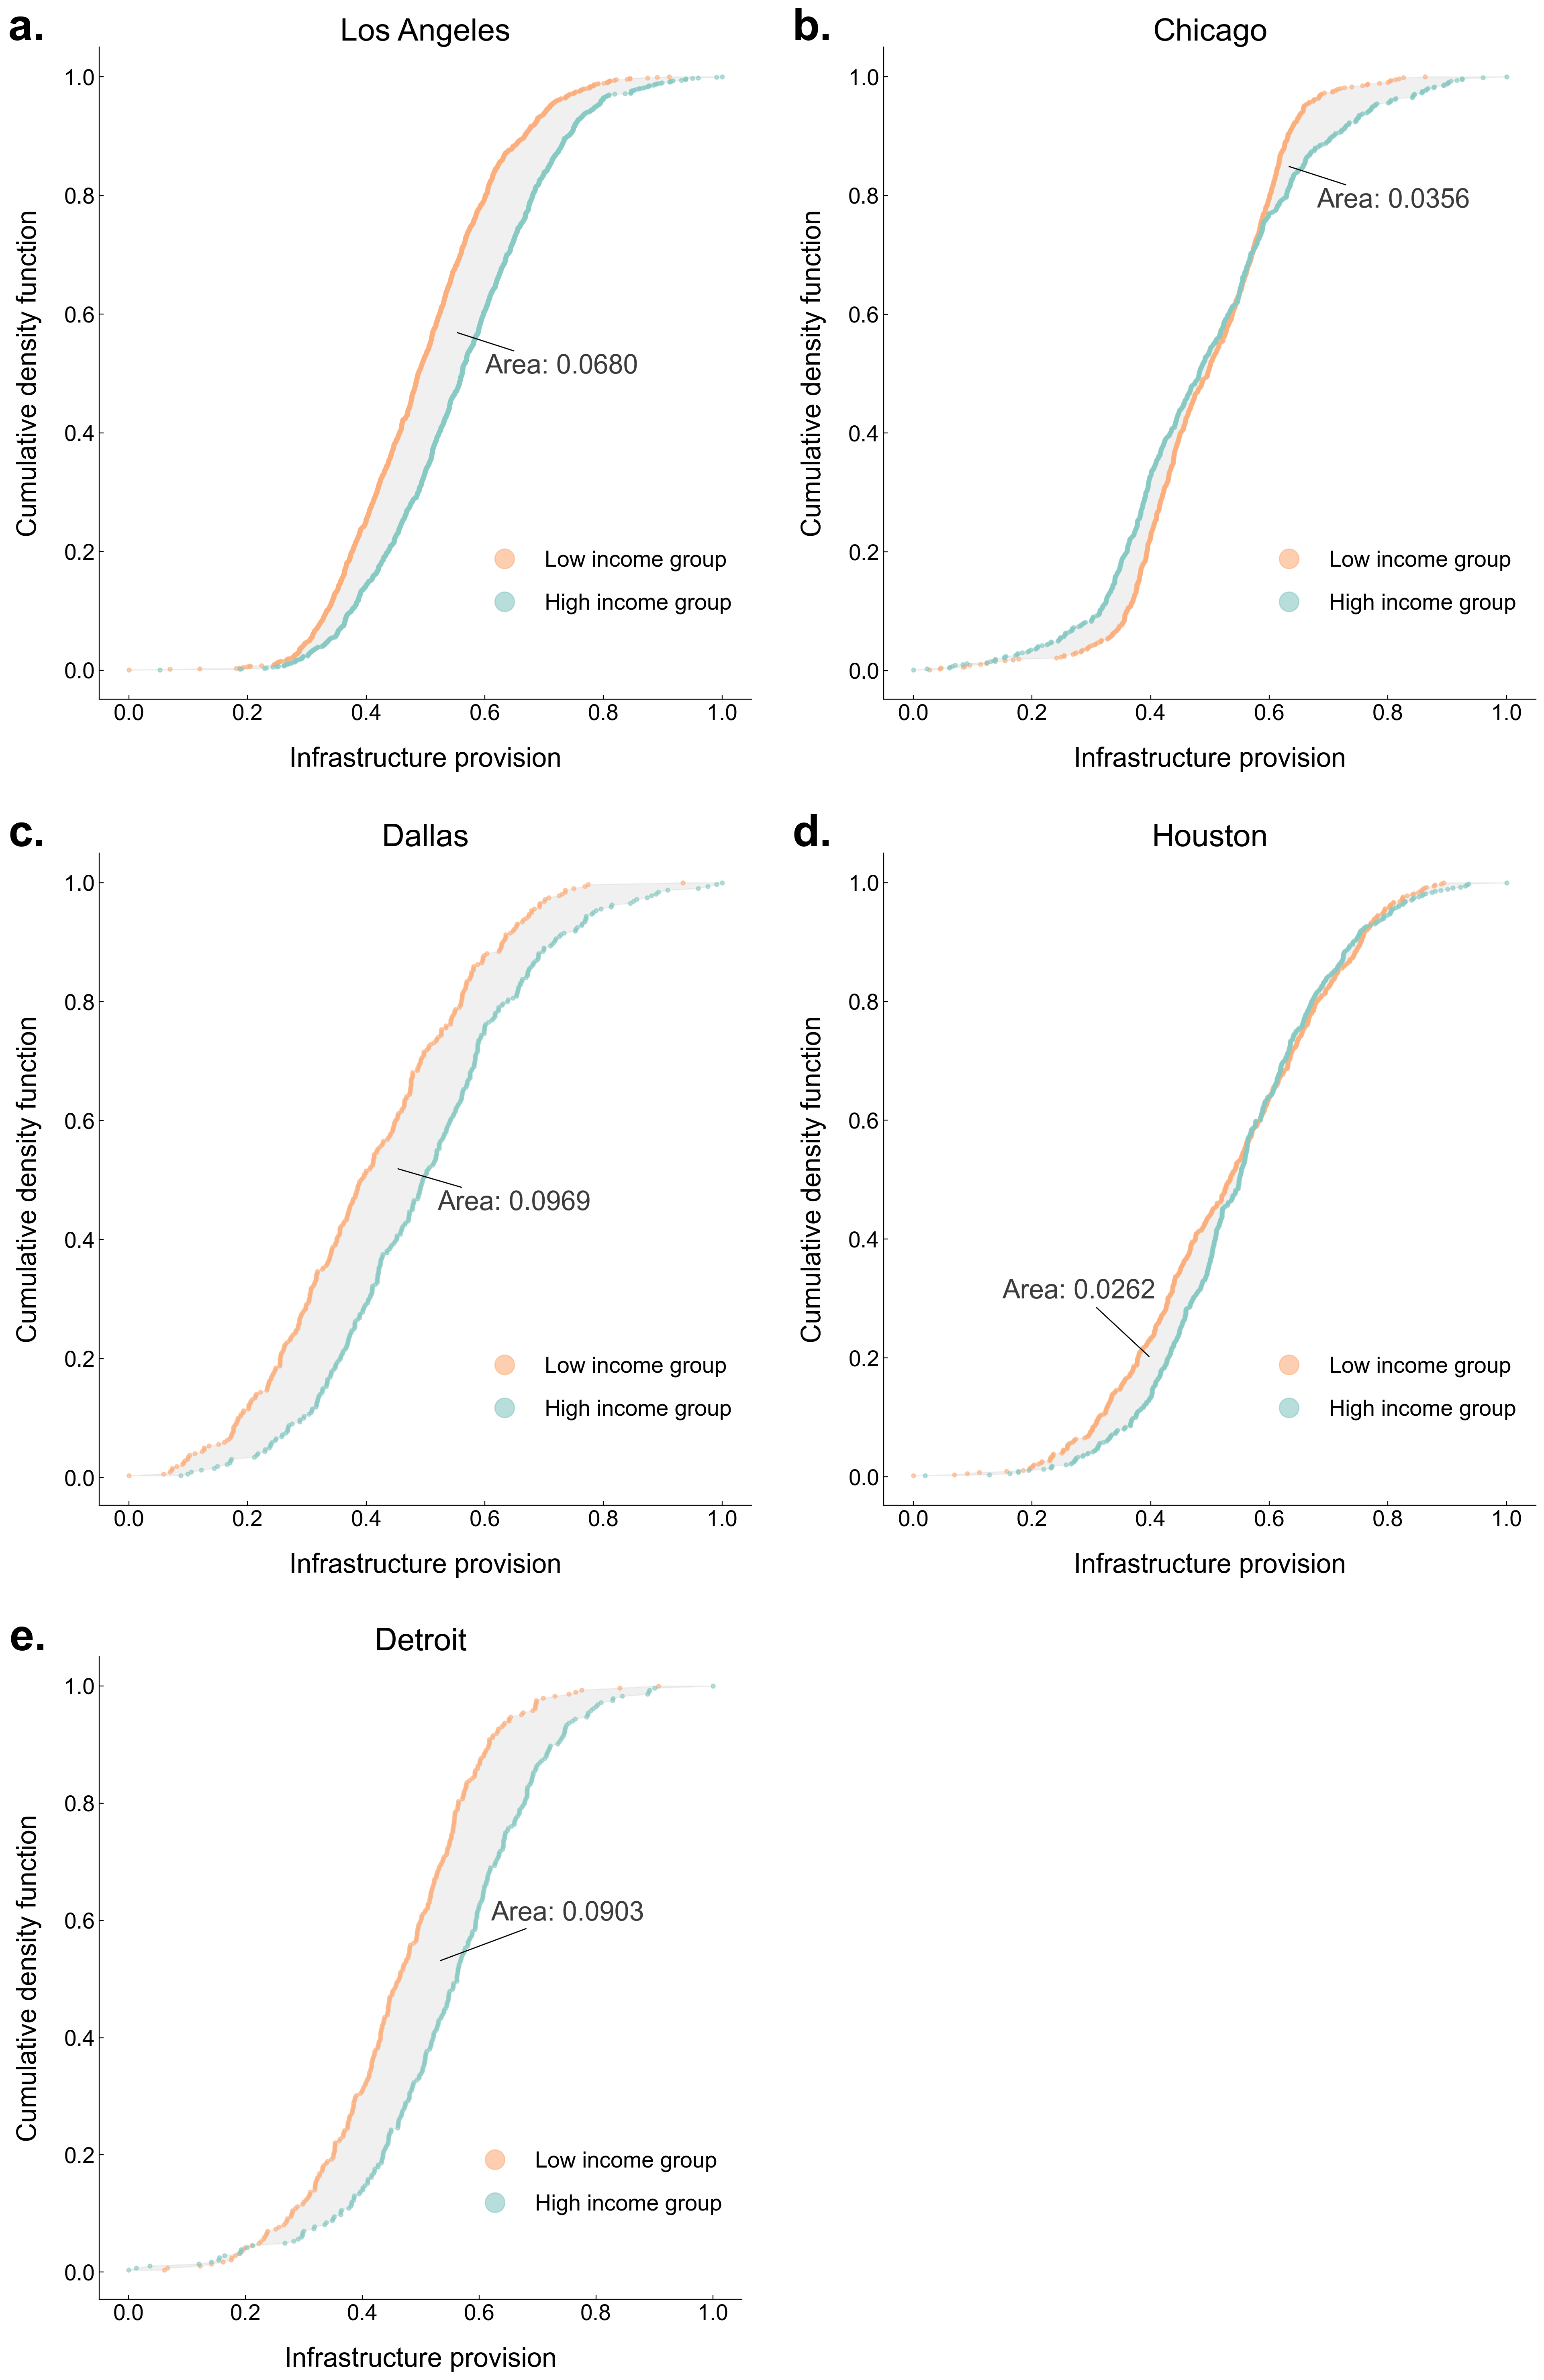
Empirical evidence show that infrastructure may trigger negative impacts on the environment (e.g. air pollution). Yet those environmental concerns have not been considered in infrastructure provision. This study applies interpretable machine learning to construct an environmental-integrated infrastructure provision index. Project Highlights:
|
|
Check out the paper here! |
Unravel Fundamental Properties of Power System Resilience Curves |
|
|
Resilience curves depict the fluctuation of system performance before, during and after a disruption. Resilience triangle has been the primary paradigm of resilience curve for over two decades. However, the model only provides a theoretical one-size-fits-all framework, with little empirical studies to delineate infrastructure curve archetypes and their fundamental properties based on observational data. This study applies time-series clustering method on outage data during extreme weather events to address the gap. Project Highlights:
|
|
Check out the paper here! |